How is the interior space represented?
Space syntax aims to provide an objective method for representing the continuous spatial layout of a building, in relation to the way we use it.
1. Convex map
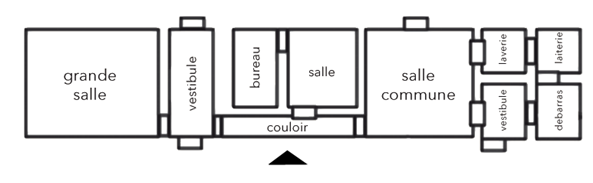
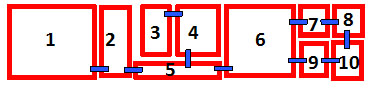
Buildings can be represented as convex maps in which rooms and doorways are treated as convex spaces and adjacent accesses as links.
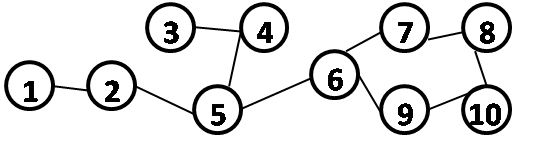
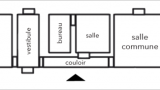
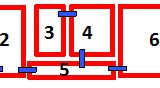
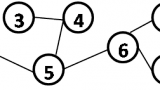
For example, the plan of a farmhouse in Normandy (A) can be converted into a convex map with convex spaces framed in red (B) and doorways denoted in blue. The convex map can then be converted into a graph (C) with rooms as nodes and doorways as links when two adjacent spaces are connected via a doorway.
For the details of creating a convex map, see the DepthMap manual.
2. Visibility graph
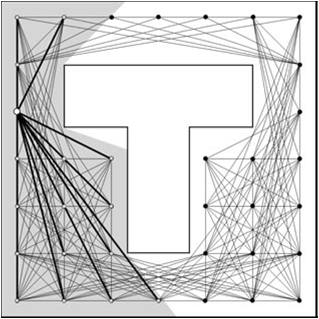
Buildings can also be represented by a grid of points to form a visibility graph, where each point is connected to every other point that it can see. In this way, every space within the layout would be categorised by their inter-visibility.
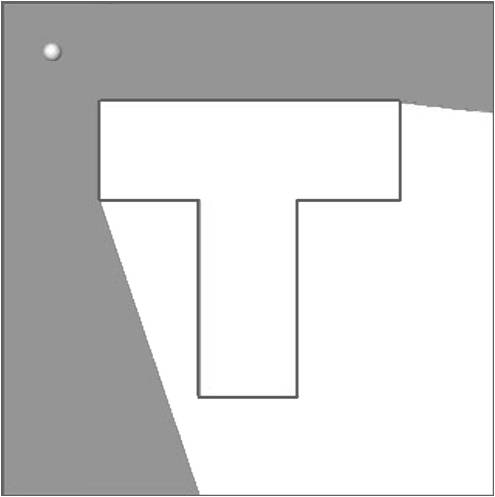
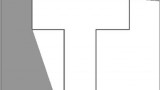
The basic constructing element of a visibility graph is the isovist (D), that is, the volume of space directly visible from a location within the space.
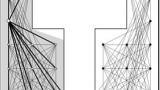
A visibility graph (E) is constructed when you overlap these isovists from every space to every other space where cells are nodes and each mutually visible connections between them are links.
For more detail, see Turner et al (2001) or the DepthMap manual.
See the tutorial for further information.
3. Other representation methods
These include isovists, agents. For fuller details, please refer to the glossary.